Q4E Case Study 7 – Newton’s Cradle Conservation of Momentum and Energy
|
Proposed Subject usage:
|
||
|
Physics A/S Level, Sports Science Degree (1st/2nd and 3rd year) |
Objective
- To demonstrate the conservation of momentum and energy using Newton’s Cradle
|
Quintic software functions used:
|
Introduction – Newton’s Cradle
Newton’s cradle consists of 5 metal balls suspended by bifilaments, to keep the movement in one plane. Each ball is set up so that at rest each ball is in contact with an adjacent ball. When an end ball is taken out of rest and pulled away, and released it swings as a pendulum and hits the next ball. At contact with this ball the energy and momentum from the first ball is transmitted through the three balls at rest to the final ball on the other end. The transferred energy and momentum cause this ball to be propelled with the same velocity as the first ball. If two or more balls are pulled up and let go, the same number of balls will be propelled from the end of the resting balls.
Momentum is defined as Mass multiplied by velocity.
Momentum = Mass X Velocity
P = Mass X Velocity
Conservation of momentum
Conservation of momentum states that the momentum of a system remains constant assuming there are no frictional forces. Loss of energy is due to friction, heat and sound. For example : A collision occurring between snooker ball 1 and snooker ball 2 in an isolated system, the total momentum of the two objects before the collision is equal to the total momentum of the two objects after the collision. The momentum lost by ball 1 is equal to the momentum gained by ball 2.
Method
The Newton’s cradle was filmed at 100Hz for 30 seconds, with a number of different starting conditions. Each video was then calibrated and each ball automatically digitised. Butterworth filters were then applied to smooth the data. The mass of the ball was also measured so that P (Momentum) can be calculated.
Mass of the ball = 22g
Mass of the ball = 0.022Kg

Figure 1: Experimental Set-up of the Newton’s Cradle during the 1 ball Trial.

Figure 2: Angular displacement is calculated by measuring the angle to the
Vertical from the Ball Centre of Mass (COM) to Pivot 1 COM
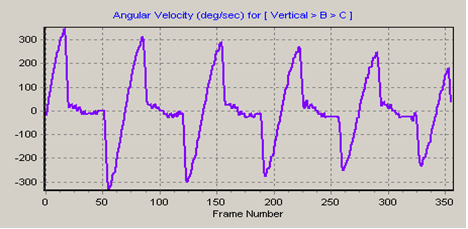
Figure 3: Quintic Angular Analysis: Angular velocity of Ball 1 during trial 1
Figure 4: Quintic Angular Analysis: Angular velocity of Ball 5 during Trial 1.

Figure 5 & 6: Quintic Angular Analysis: Angular Displacement of Ball 1 & Ball 5 during trial 1.


Trial 1
Trial one consisted of starting the pendulum by pulling ball one away from the resting pack and releasing it. The cradle was then filmed until movement had stopped.
Tables 1 and 2 show the angle of both ball 1 and 5 to the vertical, the velocity of both balls and their momentum during the first 2 swings. The highlighted figures in dark represent the point at which the moving ball strikes the static balls. During the first swing maximum momentum for ball one during its descent was 7.472, after making contact with the at rest balls, momentum and energy are transferred through the system causing ball 5 to move and reach a maximum momentum value of 7.515. Table 2 and figure 8 represent ball’s 5 descent back into the ‘at rest balls’ (swing 2). Table 2 shows that ball 5 reaches a maximum momentum of 7.47 at frame 51 before hitting the at rest balls, and ball 1 reaches maximum a momentum of 7.16 at frame 55. Figures 7 and 8 show the corresponding still frames.
| Table 1 |
Ball 1 |
Ball 5 |
||||||
|
Frame |
Angle (º) |
Velocity (deg/sec) |
Mass (Kg) |
Momentum (Kg.m/s) |
Angle (º) |
Velocity (deg/sec) |
Mass (Kg) |
Momentum (Kg.m/s) |
|
14 |
15.41 |
310.70 |
0.022 |
6.835 |
.26 |
.00 |
0.022 |
0.000 |
|
15 |
12.22 |
316.68 |
0.022 |
6.967 |
.26 |
.00 |
0.022 |
0.000 |
|
16 |
9.08 |
339.64 |
0.022 |
7.472 |
.26 |
.00 |
0.022 |
0.000 |
|
17 |
5.43 |
337.40 |
0.022 |
7.423 |
.26 |
12.90 |
0.022 |
0.284 |
|
18 |
2.33 |
258.44 |
0.022 |
5.686 |
.52 |
91.11 |
0.022 |
2.004 |
|
19 |
.26 |
142.64 |
0.022 |
3.138 |
2.08 |
220.88 |
0.022 |
4.859 |
|
20 |
.52 |
38.89 |
0.022 |
0.856 |
4.94 |
313.41 |
0.022 |
6.895 |
|
21 |
.52 |
12.84 |
0.022 |
0.283 |
8.35 |
341.61 |
0.022 |
7.515 |
|
22 |
.78 |
25.92 |
0.022 |
0.570 |
11.77 |
334.92 |
0.022 |
7.368 |
|
23 |
1.04 |
25.92 |
0.022 |
0.570 |
15.05 |
316.77 |
0.022 |
6.969 |
|
24 |
1.30 |
13.25 |
0.022 |
0.292 |
18.10 |
289.11 |
0.022 |
6.360 |

Figure 7: 12 image sequence
| Table 2 |
Ball 1 |
Ball 5 |
|||||||
|
Frame |
Angle (º) |
Velocity (deg/sec) |
Mass (Kg) |
Momentum (Kg.m/s) |
Angle (º) |
Velocity (deg/sec) |
Mass (Kg) |
Momentum (Kg.m/s) |
|
|
48 |
.52 |
.00 |
0.022 |
0.000 |
16.70 |
-292.76 |
0.022 |
-6.441 |
|
|
49 |
.52 |
.00 |
0.022 |
0.000 |
13.66 |
-300.00 |
0.022 |
-6.600 |
|
|
50 |
.52 |
.00 |
0.022 |
0.000 |
10.70 |
-318.58 |
0.022 |
-7.009 |
|
|
51 |
.52 |
.00 |
0.022 |
0.000 |
7.29 |
-339.94 |
0.022 |
-7.479 |
|
|
52 |
.52 |
-51.85 |
0.022 |
-1.141 |
3.90 |
-299.20 |
0.022 |
-6.582 |
|
|
53 |
.52 |
-155.47 |
0.022 |
-3.420 |
1.30 |
-195.02 |
0.022 |
-4.291 |
|
|
54 |
2.59 |
-259.60 |
0.022 |
-5.711 |
.00 |
-78.12 |
0.022 |
-1.719 |
|
|
55 |
5.71 |
-324.46 |
0.022 |
-7.138 |
.26 |
-26.04 |
0.022 |
-0.573 |
|
|
56 |
9.08 |
-325.52 |
0.022 |
-7.161 |
.52 |
-13.02 |
0.022 |
-0.286 |
|
|
57 |
12.22 |
-316.68 |
0.022 |
-6.967 |
.52 |
-13.02 |
0.022 |
-0.286 |
|
|
58 |
15.41 |
-294.38 |
0.022 |
-6.476 |
.78 |
-13.02 |
0.022 |
-0.286 |
|
|
59 |
18.11 |
-269.18 |
0.022 |
-5.922 |
.78 |
-13.02 |
0.022 |
-0.286 |
|

Figure 8: 12 image sequence
Trial 2
Trial two consisted of starting the pendulum by 2 balls. The cradle was then filmed until movement had stopped. Tables 3 and 4 show the angle of balls 1,2,4 and 5 to the vertical, the velocity the balls are travelling at and their maximum momentum during the first 2 swings. The highlighted figures (dark) represent the point at which the moving balls strike the static balls. During the first swing maximum momentum for ball 1 and 2 during its descent were 6.022 and 6.546 respectively, after making contact with the at rest balls, momentum and energy are transferred through the system causing balls 4 and 5 to move and reach maximum momentum values of 6.264 and 6.364 respectively. Table 4 represent balls 4 and 5 descent back into the ‘at rest balls’ (swing 2). Table 4 shows that balls 4 and 5 reach maximum momentums of 6.350 and 6.215 at frames 53 and 54 respectively before hitting the at rest balls. Balls 1 and 2 reach maximum momentum values of 5.756 and 6.015 at frames 58 and 57.
|
Table 3 |
Ball 1 |
Ball 2 |
Mass |
Ball 1 |
Ball 2 |
Ball 4 |
Ball 5 |
Mass |
Ball 4 |
Ball 5 |
|
Frame |
Velocity |
Velocity |
(Kg) |
Momentum |
Momentum |
Velocity |
Velocity |
(Kg) |
Momentum |
Momentum |
|
16 |
253.18 |
275.99 |
.02 |
5.570 |
6.072 |
38.36 |
38.95 |
.02 |
0.844 |
0.857 |
|
17 |
252.55 |
286.88 |
.02 |
5.556 |
6.311 |
38.37 |
38.89 |
.02 |
0.844 |
0.855 |
|
18 |
263.09 |
297.55 |
.02 |
5.788 |
6.546 |
25.64 |
25.92 |
.02 |
0.564 |
0.570 |
|
19 |
273.72 |
297.54 |
.02 |
6.022 |
6.546 |
38.71 |
26.21 |
.02 |
0.852 |
0.577 |
|
20 |
208.05 |
246.11 |
.02 |
4.577 |
5.414 |
103.23 |
78.28 |
.02 |
2.271 |
1.722 |
|
21 |
116.88 |
142.30 |
.02 |
2.571 |
3.131 |
194.11 |
195.80 |
.02 |
4.270 |
4.308 |
|
22 |
65.45 |
51.64 |
.02 |
1.440 |
1.136 |
259.39 |
274.54 |
.02 |
5.707 |
6.040 |
|
23 |
39.46 |
25.79 |
.02 |
0.868 |
0.567 |
284.73 |
289.28 |
.02 |
6.264 |
6.364 |
|
24 |
39.20 |
38.65 |
.02 |
0.862 |
0.850 |
273.30 |
265.56 |
.02 |
6.013 |
5.842 |
|
25 |
52.24 |
38.62 |
.02 |
1.149 |
0.850 |
246.33 |
243.51 |
.02 |
5.419 |
5.357 |
|
26 |
39.87 |
25.71 |
.02 |
0.877 |
0.566 |
236.51 |
247.39 |
.02 |
5.203 |
5.442 |
|
27 |
39.95 |
26.98 |
.02 |
0.879 |
0.593 |
230.89 |
235.65 |
.02 |
5.080 |
5.184 |
|
Table 4 |
Ball 1 |
Ball 2 |
Mass |
Ball 1 |
Ball 2 |
Ball 4 |
Ball 5 |
Mass |
Ball 4 |
Ball 5 |
|
Frame |
Velocity |
Velocity |
(Kg) |
Momentum |
Momentum |
Velocity |
Velocity |
(Kg) |
Momentum |
Momentum |
|
50 |
-26.04 |
-51.72 |
.02 |
-0.573 |
-1.138 |
-251.50 |
-255.82 |
.02 |
-5.533 |
-5.628 |
|
51 |
-26.04 |
-64.72 |
.02 |
-0.573 |
-1.424 |
-258.91 |
-279.09 |
.02 |
-5.696 |
-6.140 |
|
52 |
-26.04 |
-51.80 |
.02 |
-0.573 |
-1.140 |
-269.10 |
-288.65 |
.02 |
-5.920 |
-6.350 |
|
53 |
-38.89 |
-39.05 |
.02 |
-0.855 |
-0.859 |
-282.50 |
-287.92 |
.02 |
-6.215 |
-6.334 |
|
54 |
-77.69 |
-77.71 |
.02 |
-1.709 |
-1.710 |
-257.50 |
-260.06 |
.02 |
-5.665 |
-5.721 |
|
55 |
-156.14 |
-155.31 |
.02 |
-3.435 |
-3.417 |
-167.41 |
-156.22 |
.02 |
-3.683 |
-3.437 |
|
56 |
-233.44 |
-246.82 |
.02 |
-5.136 |
-5.430 |
-64.70 |
-38.63 |
.02 |
-1.423 |
-0.850 |
|
57 |
-258.98 |
-273.41 |
.02 |
-5.698 |
-6.015 |
-38.64 |
-13.01 |
.02 |
-0.850 |
-0.286 |
|
58 |
-261.62 |
-247.42 |
.02 |
-5.756 |
-5.443 |
-37.93 |
-26.42 |
.02 |
-0.835 |
-0.581 |
|
59 |
-254.10 |
-236.43 |
.02 |
-5.590 |
-5.201 |
-37.78 |
-26.00 |
.02 |
-0.831 |
-0.572 |
|
60 |
-241.74 |
-226.08 |
.02 |
-5.318 |
-4.974 |
-38.40 |
-25.99 |
.02 |
-0.845 |
-0.572 |
|
61 |
-225.90 |
-213.48 |
.02 |
-4.970 |
-4.697 |
-12.79 |
-38.96 |
.02 |
-0.281 |
-0.857 |
Trial 3
Trial three consisted of starting the pendulum by pulling ball one, two and three away from the resting pack and releasing it. Please download pdf document for further details (Bottom of page):
Trial 4
Trial four consisted of starting the pendulum by pulling four balls away from the static and releasing them. Please download pdf document for further details (Bottom of page):
Summary
In summary to illustrate whether the Newton’s cradle does demonstrate conservation of linear momentum, the total momentum of the active balls was calculated before and after contact with static balls. Total momentum was calculated by adding together the individual velocities of each ball to gain the total active velocity this total was then multiplied by the mass to calculate total momentum. Total momentum was also used to individual ball momentums within the system can vary widely so by calculating the total momentum and velocity the likelihood of error is reduced.
Table 5 illustrates the total momentum values through swing 1, trial 1 (the yellow highlighted row in each table represents contact point with the static balls). Peak momentum for ball 1 occurs 4 frames before contact with the static balls with a value of 5.98, after contact with the static balls, momentum transfers through the system to ball 5. Ball 5 reaches its peak momentum of 5.56 3 frames after ball 1 contacted the static pack. This trial demonstrated a 92% efficient transfer of momentum through the system
|
Table 5
|
Velocity
|
Total
|
Velocity
|
Total
|
|
Frame |
Ball 1(deg/sec) |
Momentum |
Ball 5 (deg/sec) |
Momentum |
|
14 |
299.14 |
5.98 |
7.60 |
0.15 |
|
15 |
298.18 |
5.96 |
21.56 |
0.43 |
|
16 |
277.65 |
5.55 |
52.93 |
1.06 |
|
17 |
237.87 |
4.76 |
101.19 |
2.02 |
|
18 |
187.76 |
3.76 |
157.15 |
3.14 |
|
19 |
140.07 |
2.80 |
208.56 |
4.17 |
|
20 |
101.78 |
2.04 |
246.75 |
4.93 |
|
21 |
73.89 |
1.48 |
269.36 |
5.39 |
|
22 |
54.27 |
1.09 |
278.54 |
5.57 |
|
23 |
40.81 |
0.82 |
277.87 |
5.56 |
|
24 |
31.56 |
0.63 |
270.57 |
5.41 |
Table 6 illustrates the total momentum values through swing 1, trial 2. Peak momentum for the active balls occurs 5 frames before contact with the static balls with a value of 20.60, after contact with the static balls, momentum transfers through the system to ball 4 and 5. Balls 4 and 5 reach their peak momentum of 18.54 3 frames after balls 1 and 2 originally contacted the static pack. This trial demonstrated a 90% efficient transfer of momentum through the system.
|
Table 6 |
Velocity |
Velocity |
Sum (1&2) |
Sum (1&2) |
Velocity |
Velocity |
Sum (4&5) |
Sum (4&5) |
|
Frame |
Ball 1 |
Ball 2 |
Velocity |
Momentum |
Ball 4 |
Ball 5 |
Total Velocity |
Momentum |
|
16 |
243.71 |
271.24 |
514.95 |
20.60 |
34.27 |
37.93 |
72.20 |
2.89 |
|
17 |
241.42 |
270.01 |
511.43 |
20.46 |
45.56 |
45.02 |
90.58 |
3.62 |
|
18 |
225.54 |
253.25 |
478.79 |
19.15 |
69.39 |
66.17 |
135.56 |
5.42 |
|
19 |
196.56 |
220.11 |
416.67 |
16.67 |
105.44 |
102.45 |
207.89 |
8.32 |
|
20 |
161.01 |
177.80 |
338.81 |
13.55 |
146.63 |
145.19 |
291.82 |
11.67 |
|
21 |
127.34 |
136.85 |
264.19 |
10.57 |
183.64 |
183.36 |
366.99 |
14.68 |
|
22 |
100.40 |
103.89 |
204.30 |
8.17 |
210.15 |
210.13 |
420.28 |
16.81 |
|
23 |
81.03 |
79.69 |
160.72 |
6.43 |
225.19 |
225.60 |
450.79 |
18.03 |
|
24 |
67.19 |
61.66 |
128.85 |
5.15 |
231.15 |
232.31 |
463.45 |
18.54 |
|
25 |
57.59 |
47.54 |
105.13 |
4.21 |
230.84 |
231.60 |
462.43 |
18.50 |
|
26 |
50.74 |
35.56 |
86.31 |
3.45 |
225.95 |
224.42 |
450.37 |
18.01 |
|
27 |
45.83 |
24.91 |
70.74 |
2.83 |
217.51 |
212.22 |
429.73 |
17.19 |
Conservation of Energy
Newton’s cradle also demonstrates conservation of energy; the Kinetic and potential energy of the balls can be calculated by using the following equation:
KE = m*v2/2
KE = Kinetic Energy
m = Mass
V = Velocity
PE = mgh
PE = Potential Energy
m = Mass
g = Gravitational Constant
h = Displace vertical height
Vertical displacement of the ball is calculated by measuring the maximum height of the balls COM to a line that runs through the balls static COM. Point of maximum height and velocity were calculated by exporting the data, from Quintic Linear Analysis. The Gravitational constant was taken as 9.81, and the mass of the balls was measured as 0.022Kg. Appendix A shows the kinetic and potential energy of the five balls throughout the first pendulum swing. Graph 1 illustrates the tabular data from Appendix A.
The Graph shows that at the start of the swing, ball one has a potential energy value of 0.005J, and a kinetic energy value of 0.0001.As the ball begins to descend down its arc, potential energy decreases as it is being converted in to kinetic energy. This is known as an inverse relationship, as one value increases the other decreases. As energy cannot be created or destroyed the potential energy is converted into kinetic energy
Graph 1 also demonstrates that during the first swing the cradles total energy remains constant, throughout the downswing of ball 1 and the upswing of ball 5, demonstrating that conservation of energy took place and balls 11 energy was transferred through the static balls into ball 5. The graph does demonstrate a decrease in system total energy 3 / 4 frames before contact and 3 / 4 frames after contact this is due to a smoothing error in the data. If the experiment continued we would expect to see the same kinetic energy and potential energy relation ships, although kinetic potential and total system energy values would decrease due to the energy lost through heat sound and frictional forces.

Graph 1: Kinetic Energy, Potential Energy and the Total System Energy during swing 1
|
Frame Number |
Total System Kinetic Energy |
Total System Potential Energy |
System Total Energy |
|
2 |
0.0001 |
0.0053 |
0.0054 |
|
3 |
0.0002 |
0.0052 |
0.0054 |
|
4 |
0.0003 |
0.0051 |
0.0054 |
|
5 |
0.0006 |
0.0049 |
0.0054 |
|
6 |
0.0008 |
0.0046 |
0.0054 |
|
7 |
0.0012 |
0.0042 |
0.0054 |
|
8 |
0.0015 |
0.0038 |
0.0053 |
|
9 |
0.0019 |
0.0034 |
0.0053 |
|
10 |
0.0023 |
0.0030 |
0.0053 |
|
11 |
0.0027 |
0.0025 |
0.0053 |
|
12 |
0.0031 |
0.0021 |
0.0052 |
|
13 |
0.0035 |
0.0017 |
0.0052 |
|
14 |
0.0038 |
0.0013 |
0.0051 |
|
15 |
0.0038 |
0.0010 |
0.0049 |
|
16 |
0.0035 |
0.0008 |
0.0043 |
|
17 |
0.0030 |
0.0007 |
0.0037 |
|
18 |
0.0026 |
0.0007 |
0.0033 |
|
19 |
0.0026 |
0.0007 |
0.0033 |
|
20 |
0.0030 |
0.0008 |
0.0037 |
|
21 |
0.0034 |
0.0009 |
0.0043 |
|
22 |
0.0036 |
0.0012 |
0.0048 |
|
23 |
0.0035 |
0.0015 |
0.0050 |
|
24 |
0.0033 |
0.0019 |
0.0052 |
|
25 |
0.0029 |
0.0024 |
0.0053 |
|
26 |
0.0025 |
0.0028 |
0.0054 |
|
27 |
0.0021 |
0.0033 |
0.0054 |
|
28 |
0.0017 |
0.0037 |
0.0054 |
|
29 |
0.0013 |
0.0042 |
0.0055 |
|
30 |
0.0010 |
0.0045 |
0.0055 |
|
31 |
0.0007 |
0.0048 |
0.0055 |
|
32 |
0.0004 |
0.0051 |
0.0055 |
|
33 |
0.0002 |
0.0053 |
0.0055 |
|
34 |
0.0001 |
0.0054 |
0.0055 |
|
35 |
0.0000 |
0.0054 |
0.0055 |
|
36 |
0.0000 |
0.0055 |
0.0055 |
Future Studies
Future studies should investigate whether Newton’s cradle still demonstrates the laws of momentum and energy conservation if the following set-ups are used.
- Series of different size balls, with the same mass.
- Series of balls with different masses
- Different pendulum lengths.
Downloads
|
Written Case Study
|
Excel Data Spreadsheet
|
Video avi. files
|
|
~0.5 MB |
~0.6 MB
|
Video 1 ~1.0 MB
|